Generalizing a LiDAR localizer to ridiculous extents
You have been kidnapped and dropped into a random warehouse. All you get is one look around and a map of the building with no colour on it. Can you tell where you are?
That was eternal.ag’s challenge at TechQuest, a new two-week hackathon at IIT Patna. A robot is dropped somewhere in a building. You get one 360° LiDAR sweep (a 32-beam laser scanner that returns a cloud of 3D points), one camera frame, and a point cloud of the building with geometry only, no colour. There’s no GPS and no starting guess. You output the robot’s full 6-DoF pose.
Each scenario is scored on translation error e_t and rotation error e_r:
L = 0.7 * min(e_t / 2 m, 1) + 0.3 * min(e_r / 20°, 1)
score = 100 * (1 - mean L)
So an answer 2 m or more off in position earns nothing on that term, and an answer within a few centimetres earns almost full marks. We also tracked SR@fine, the fraction of scenarios within 0.5 m and 5°.
We had one development map: a 161 × 98 × 12 m warehouse with 40 scans and their ground-truth poses. We call it dev.
From day one we bet that the hidden set would be the same warehouse with new poses, so we tuned for that warehouse and nothing else. With four days to go we scored 99.9 out of 100 on dev.
With two days to go, eternal.ag clarified that the eval map could be anything: a small room, a kilometres-long road with two dashed lines painted on it. We generated a few maps like that and ran the same code on them.

On a 400 m dashed corridor it scored 1.22, which is WORSE than guessing at random (1.64).
Every constant in our pipeline was a fact about that one warehouse. This post is about the two days we spent rebuilding the search so it measures those facts from whatever map it’s given. Along the way we found that our own benchmark was flattering us by up to 87 points, and that most of our failures had a different cause from the one we’d been working on.
Act I: getting very good at one warehouse
How the baseline works
The baseline that came with the challenge treats localization as image matching. It cuts the map into horizontal height bands (floor level, rack level, ceiling and so on) and flattens each band into a top-down occupancy image. It does the same to the scan, then slides the scan’s images over the map’s images at every position and every heading and scores the overlap. An FFT makes that exhaustive search cheap. The peaks of the resulting score surface are candidate poses, and the best one is refined with ICP, which nudges the scan until its points sit on the map’s surfaces.
It scored 97.74 on dev, and missed exactly one scenario.
The shelf in the wrong bay
On one scenario, number 14, the baseline got the heading right to 0.08° and the position across the aisle right to 3 mm. It was 110 m off along the aisle: the racks repeat every 5 m, and it had picked the right shelf in the wrong bay.
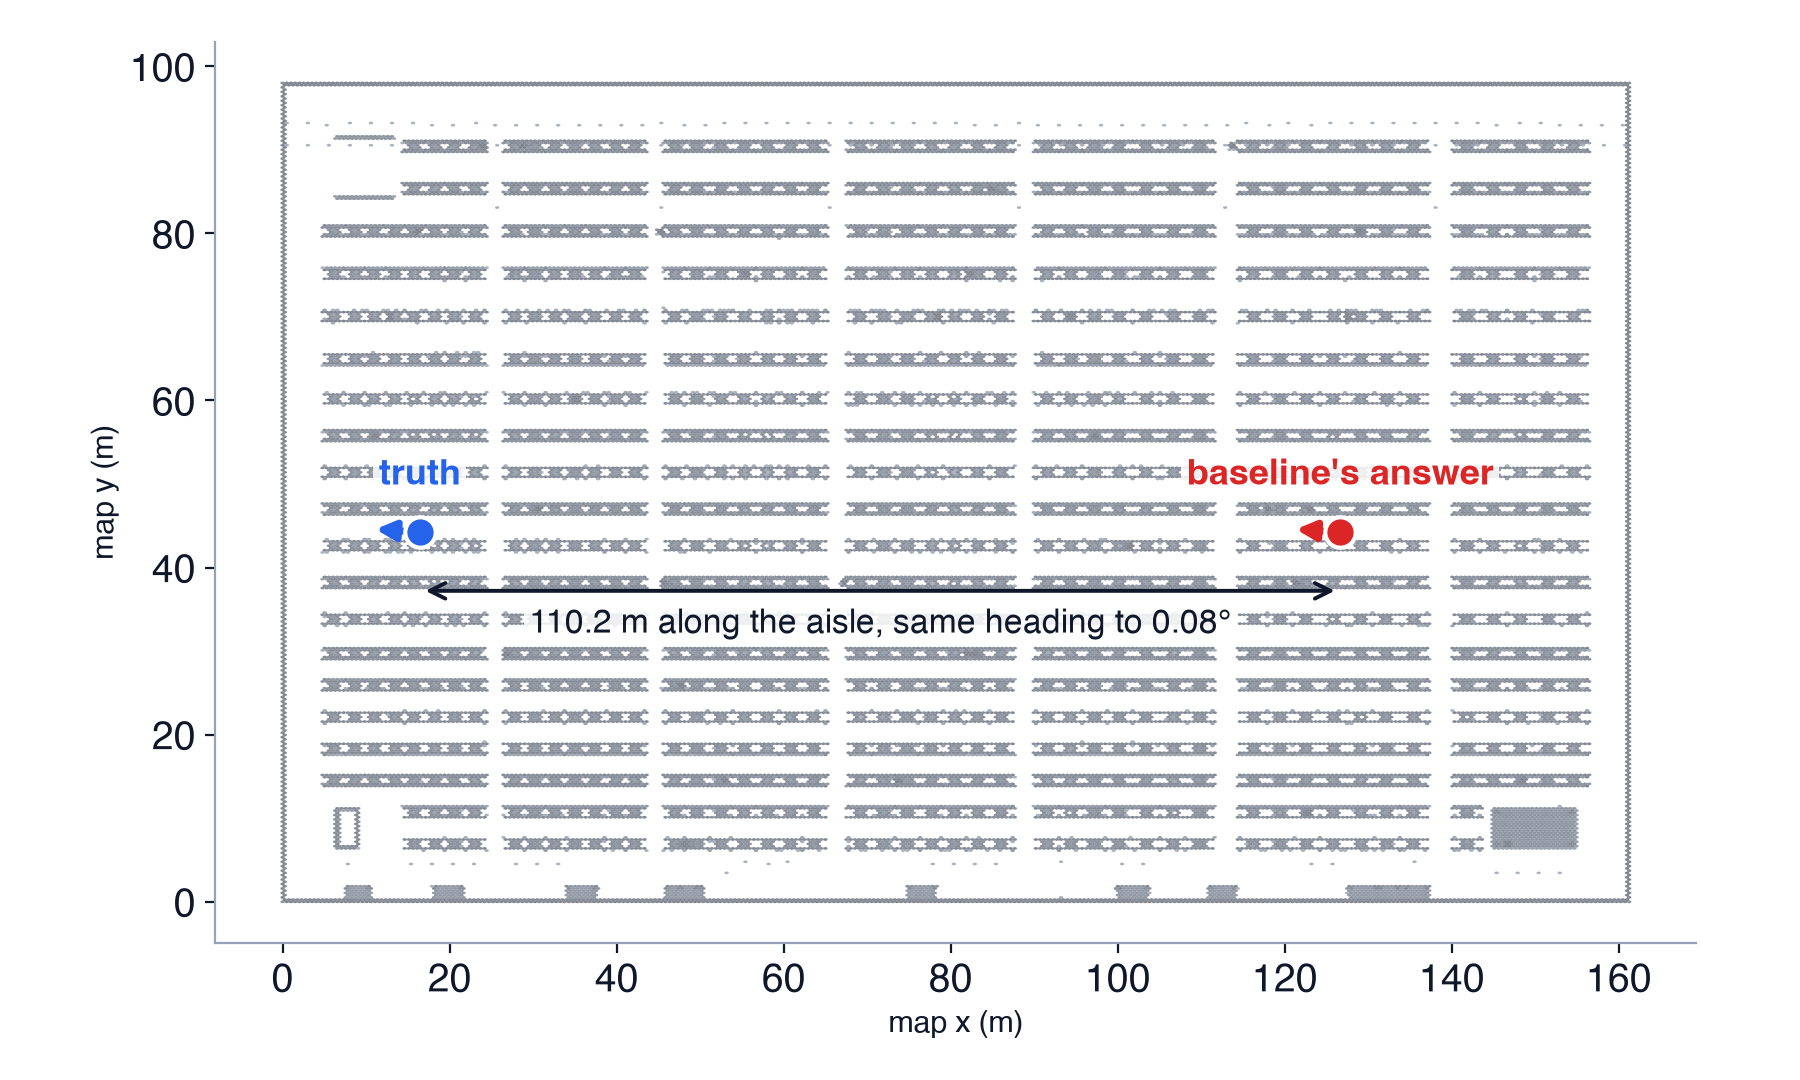
From the scan’s point of view, those two places look the same at rack height. What
tells them apart is higher up. The ceiling lattice repeats every 8 m, which doesn’t
line up with the 5 m racks, so the ceiling band sees a different pattern at the
two spots. The baseline gave the rack band (2.5 to 5 m) double weight. Dropping it
to the same weight as the others, [1,1,1,2,2] to [1,1,1,1,2], let the ceiling
break the tie. That fixed scenario 14 and took dev to 99.51, 40 out of 40.
Squeezing out the rest
With every scenario in the right place, the remaining error was all precision, so the next gains came from refinement:
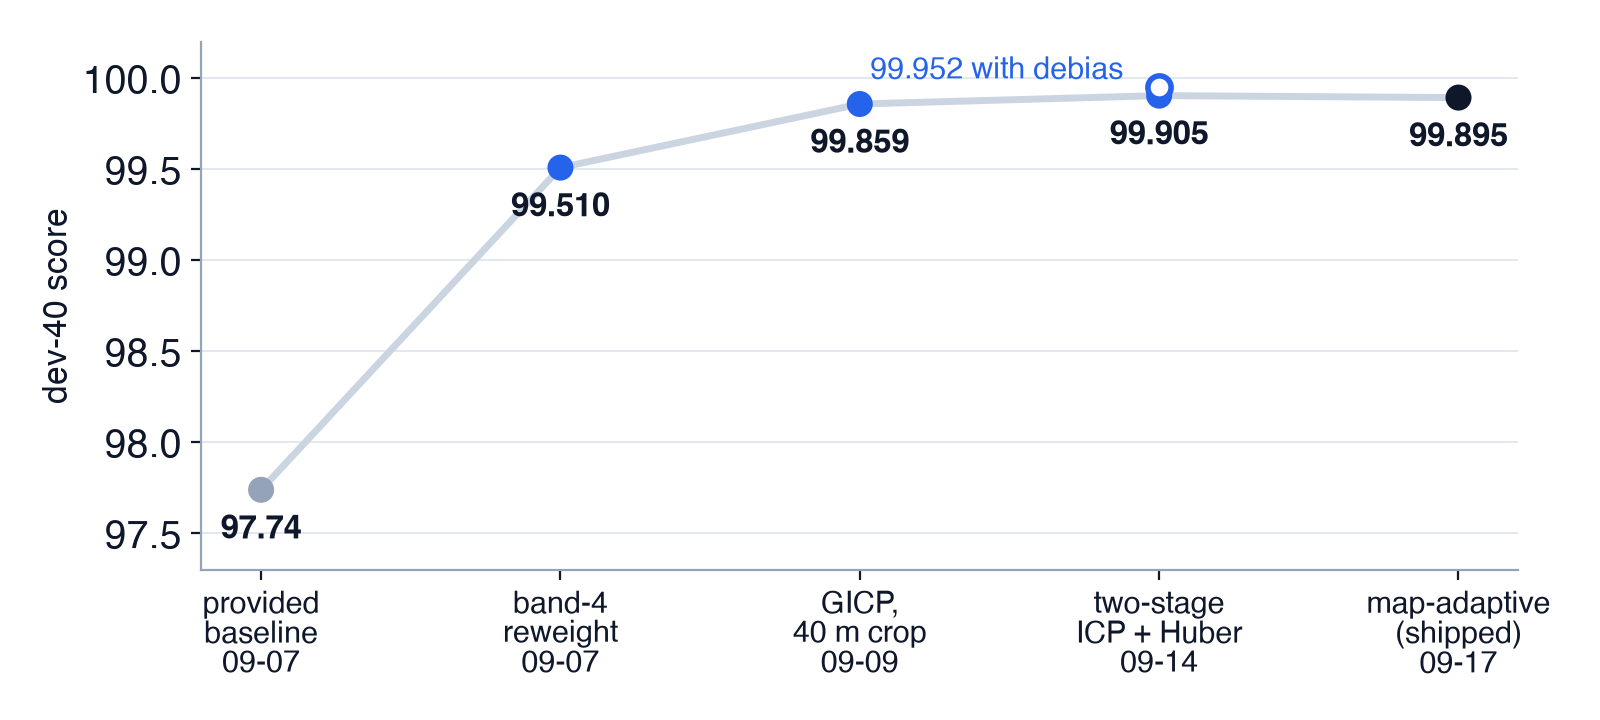
| days left | version | dev score | what moved it |
|---|---|---|---|
| 11 | provided baseline | 97.74 | starting point |
| 11 | rack band reweighted | 99.51 | fixes scenario 14 |
| 9 | GICP, 40 m crop | 99.86 | better registration |
| 4 | two-stage ICP + Huber loss | 99.905 (99.952 with the offset correction below) | refinement precision |
The refiner nudges the scan until it lines up with the map. We switched to a version (GICP) that treats walls and floors as flat surfaces, and had it only look at the map within 40 m of the robot. That’s 99.86. A second, finer pass, plus a rule that stops a few bad matches from dragging the answer off, got us to 99.905.
What didn’t work
We thought the camera could tell the repeating aisles apart, and a camera-based check did pick the right pose 37 out of 40 times. The trouble is that every close call on dev was the right direction in the wrong spot. A single camera can’t judge distance, so it can’t tell one identical aisle from the next. The LiDAR sees all the way around and measures distance to about 2 cm, the camera sees 90° and measures none, and the map has no colour to compare pixels against. Letting the camera break ties looked like it would cost about 5 points, so we left it off.
Searching coarse-to-fine (a rough pass first, then a detailed one) was faster but less accurate on two of our synthetic test sets. When we looked closer, 92.6% of the gain we’d credited to it actually came from switching to GICP at the same time.
Hedging didn’t help either. You can submit three weighted guesses per scenario, but splitting the weight costs you whenever your first guess is right, and ours was right on all 40. We checked anyway: one guess is best.
Fine-tuning the heading helped on synthetic scans but cost 3.45 points on real scans with half the view blocked. The hand-tuned tweak we expected to break, dropping the floor band, held up.
The 3 mm that wasn’t ours
At 99.9 the leftover error was 93% translation, and it had a strange pattern. Every one of the 40 answers was shifted about +2.9 mm along the map’s x axis. It showed up in every configuration we had, including the untouched baseline. Subtracting it was worth +0.05.
We spent more time on those 3 mm than on anything else. One at a time we ruled out scan noise, grid resolution, surface normals, the robust loss, five ICP variants, downsampling, map tilt and range scale. What settled it was starting the refiner exactly at the ground-truth pose. It walks 2.4 mm away, every time.
The map and the ground truth disagree by 2.4 mm. The best possible fit of a scan against this map isn’t at the true pose, so no registration method can score past that on raw poses. Subtracting the offset looked defensible, since a quirk of the map would carry over to an evaluation on the same map.
The day the problem statement changed
Then, with two days to go, the clarification came. The eval map is anonymous, and it replaces the dev warehouse inside the code we submit. Our bet was wrong.
We measured what it cost that evening, with 30 synthetic poses per map:
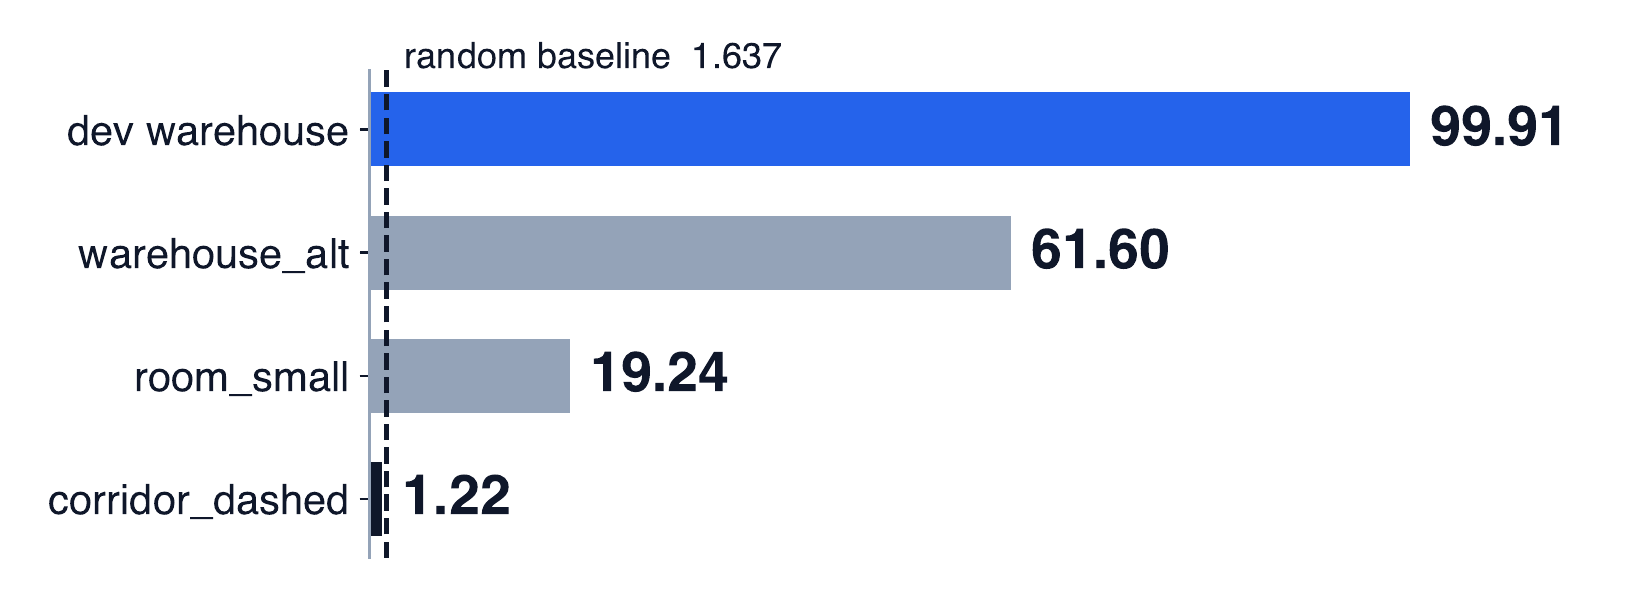
The second warehouse hurt most. It’s the same kind of building with a different rack pitch, and we lost 38 points on it.
Every constant was a fact about dev
Every constant we checked was a measurement of dev:
- Band heights were fractions of the map’s height. On dev that gives bands from 0.12 to 10 m. In a 1.3 m corridor it gives bands from 1 cm to 1.1 m.
- The search window around the scan was capped by the map’s narrow side. An 8 m wide corridor got a 3.2 m window, so a 70 m sensor threw away every return along the corridor.
- The suppression radius was 5.0 m, which is the dev rack pitch.
- The sensor height was fixed at 1.0 m.
Act II: letting the map set the constants
We rebuilt the search so every constant is derived at runtime from the map and the sensor it’s handed. The code contains no map names, size classes or per-map settings.
- Bands use fixed metre heights above a floor level estimated from the map.
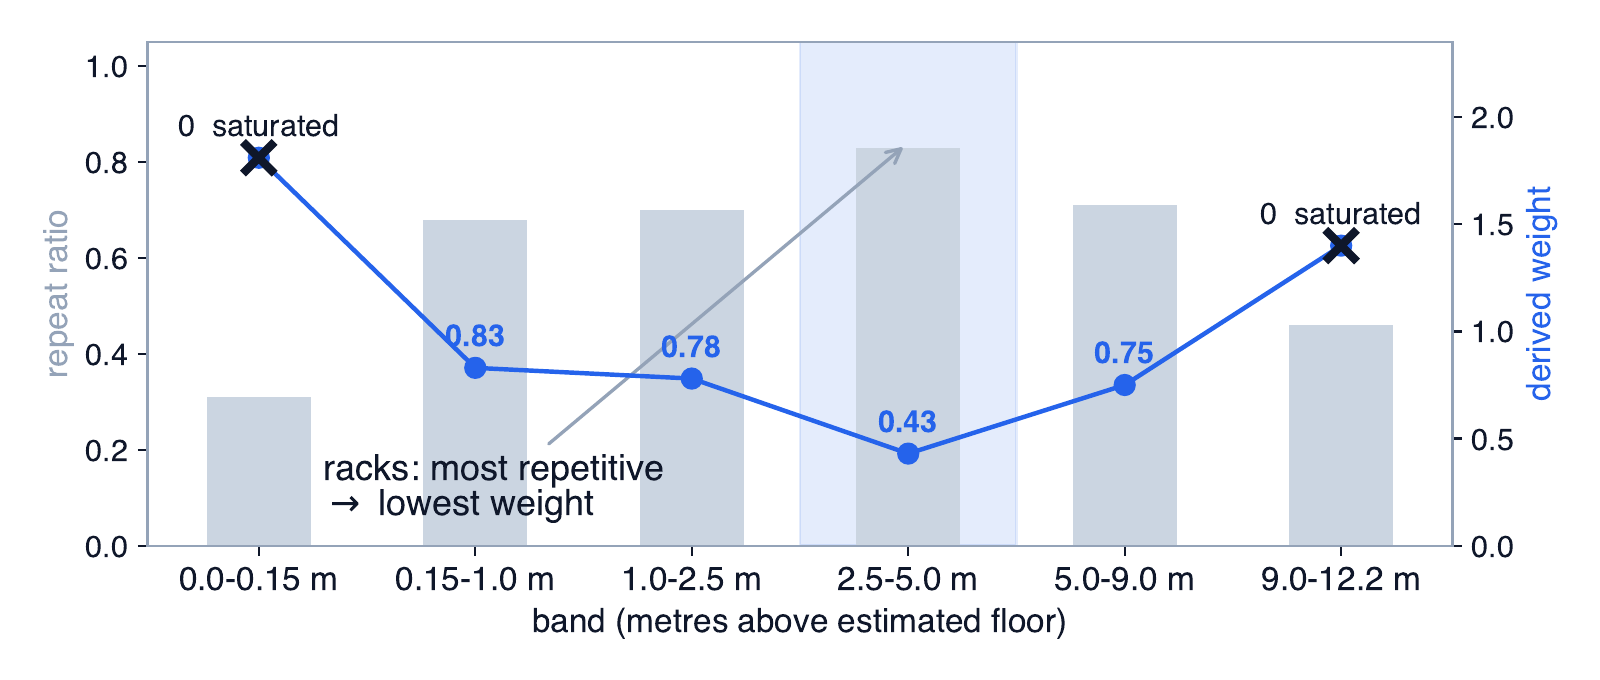
- Band weights come from how repetitive each band is. We measure that with autocorrelation: shift the band’s top-down image against itself and see how well it matches. A band that matches itself well at some offset (like racks every 5 m) is repetitive and gets less weight. A band that is nearly solid, such as a concrete floor slab or a roof deck, carries no position information and gets none.
- Grid resolution comes from the map’s area under a memory budget.
- The suppression radius is the width of the correlation peak itself: 0.27 m on dev and 0.90 m in a curved tunnel. More on why that matters below.
- Sensor height is measured from each scan’s own floor returns. That needs a guard, because at −15° the lowest beam first reaches the floor 3.7 m out. In a 3 × 2.6 m room every downward beam hits a wall before it hits the floor.
The result we like most is on dev. With no dev tuning, the derived weights give the 2.5 to 5 m rack band the lowest weight and the ceiling one of the highest. That’s the same fix we found by hand for scenario 14 in week one, now coming out of a measurement:
Our own benchmark was lying to us
To develop on anything besides dev, we needed more maps. We wrote a generator for 18 test maps of different kinds (small rooms, an L-shaped room, an apartment, an office, a lab, three corridors, a tunnel, a street, an open yard, a garage, an atrium, a sloped floor and three warehouses) and rendered 30 LiDAR scans per map with known ground truth.
The first results looked excellent. Suspiciously excellent. The open yard, a nearly empty paved area with almost nothing to line up against, scored 91.
An empty yard should be hard. Something was handing the localizer the answer, and it wasn’t anything in the yard.

You thought the localizer had gotten good? It was me, the renderer!
Our renderer cast the synthetic scans against the same point cloud that we then handed to the localizer as its map. A point cloud has random density: some cells have a few more points than others. The scan inherited exactly that pattern, so scan and map shared a fingerprint, and the correlation search matched the fingerprint instead of the geometry.
We re-rendered every scan against an independent sampling of the same geometry, changing nothing else. The yard fell from 91.4 to 3.9. The garage fell from 95.4 to 31.3.
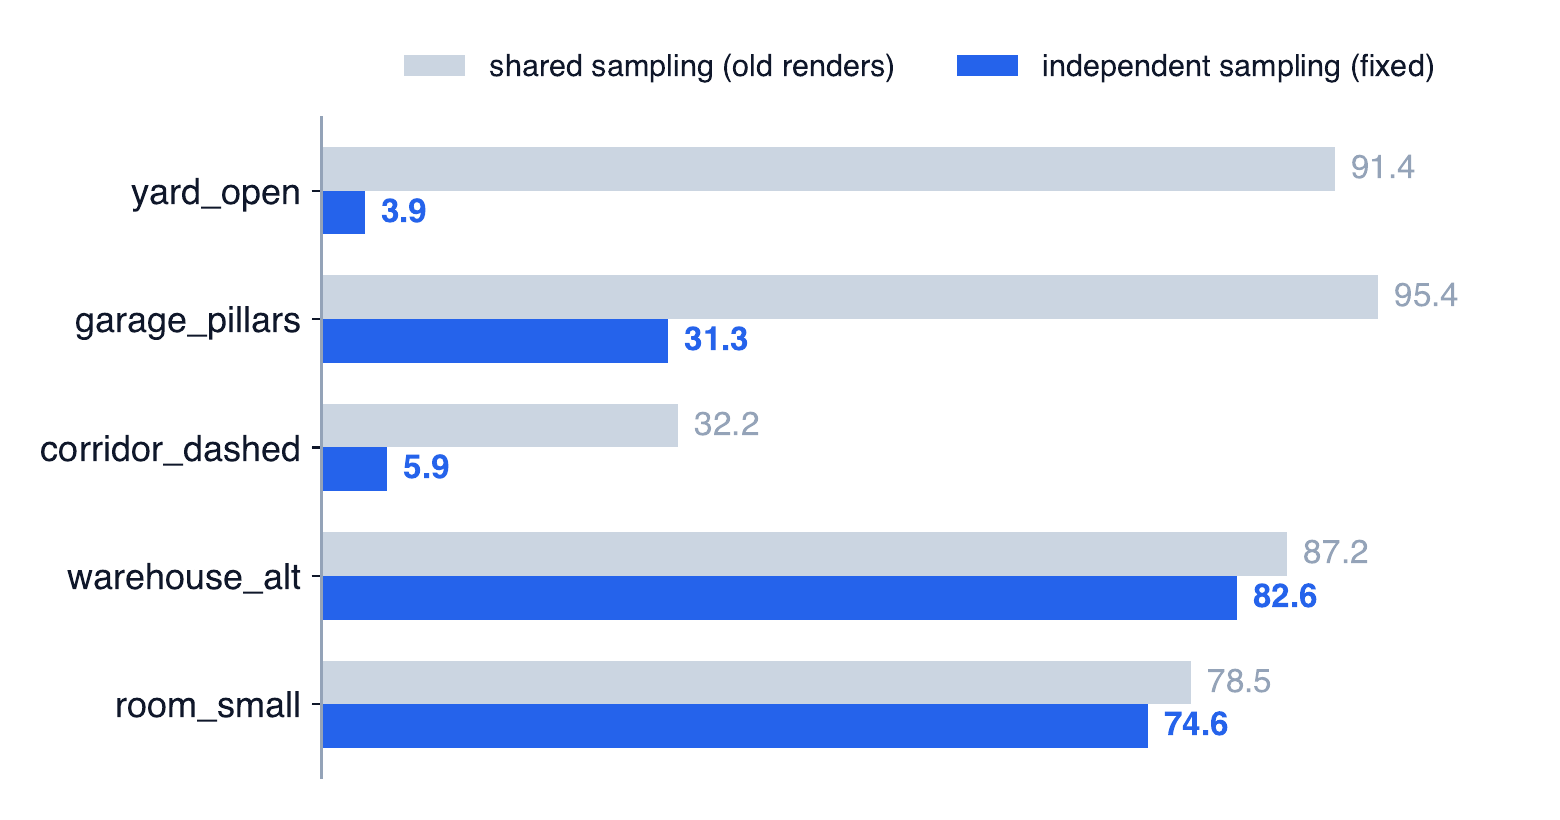
The effect is largest where the map has the least real structure, which is where a fingerprint has the least competition. We threw out every synthetic number from before the fix, and everything below is on the corrected benchmark. Dev was never affected: its scans are real.
Most failures happened before refinement
The search produces a shortlist of candidate poses, and later stages pick and refine the best one. A failure can happen at three points: the true pose never makes the shortlist, it makes the shortlist but loses the ranking, or it wins but refinement lands it in the wrong spot. Candidate recall is the first one: does the correct pose survive into the shortlist at all?
We sorted 355 failures on the corrected benchmark.
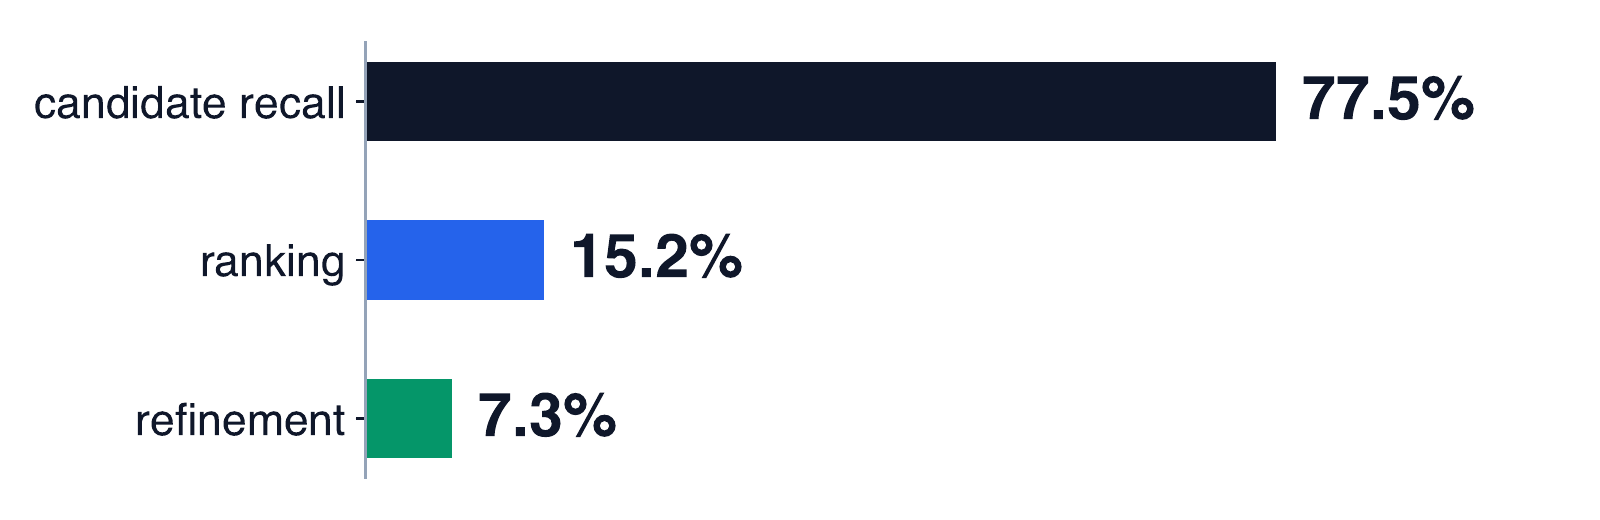
77.5% were recall failures. Most of Act I had gone into refinement and ranking, and no amount of either can recover a pose that was never on the list.
So we scored the correlation surface directly at the ground-truth pose. The truth was almost always a strong peak. In the curved tunnel, which scored 24.78 with SR@fine 0.000, the true pose was among the top four peaks in every failing scan. The search had found it, and then suppression deleted it.
After taking the best peak, the search blanks out everything within a radius so the next candidate is a different place. The first map-adaptive version set that radius to a tenth of the search window, which is 7 m on any map scanned with a 70 m sensor. If a wrong peak scored slightly higher and sat within 7 m of the truth, the truth was erased. In the tunnel, 66% of recall failures sat inside another candidate’s exclusion zone.
The fixes were:
- set the suppression radius from the width of the correlation peak itself;
- keep every true local peak instead of just the single highest cell and its neighbours;
- keep 128 candidates instead of 8;
- choose among them by inlier ratio: place the whole scan at each candidate pose and count the fraction of its points that land within a tight distance of the map.
The share of scenarios with the truth in the shortlist went from 0.496 to 0.668, and the mean over the 18 unseen maps went from 47.21 to 56.56.
The far returns decide the office map
The office map is a grid of thin partitions with desks scattered through it:
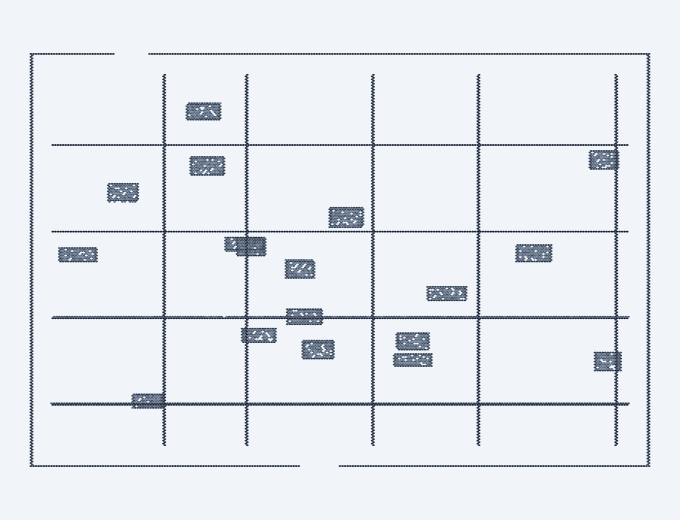
After the recall fixes, the truth was in the shortlist and we still picked the wrong pose. When we compared the true pose and the wrong pose that won, on three scenarios, the wrong pose had the higher inlier ratio every time (for example 0.918 against 0.822). Nearby, one office bay looks like the next, and the wrong pose actually fit the nearby walls slightly better.
The far returns disagreed. Returns from the outer half of the search window are only 0.3 to 0.7% of the scan, but at the truth none of them missed the map, while at the wrong pose up to all of them did. An average over the whole scan drowned that signal in near-field points that pointed the wrong way.
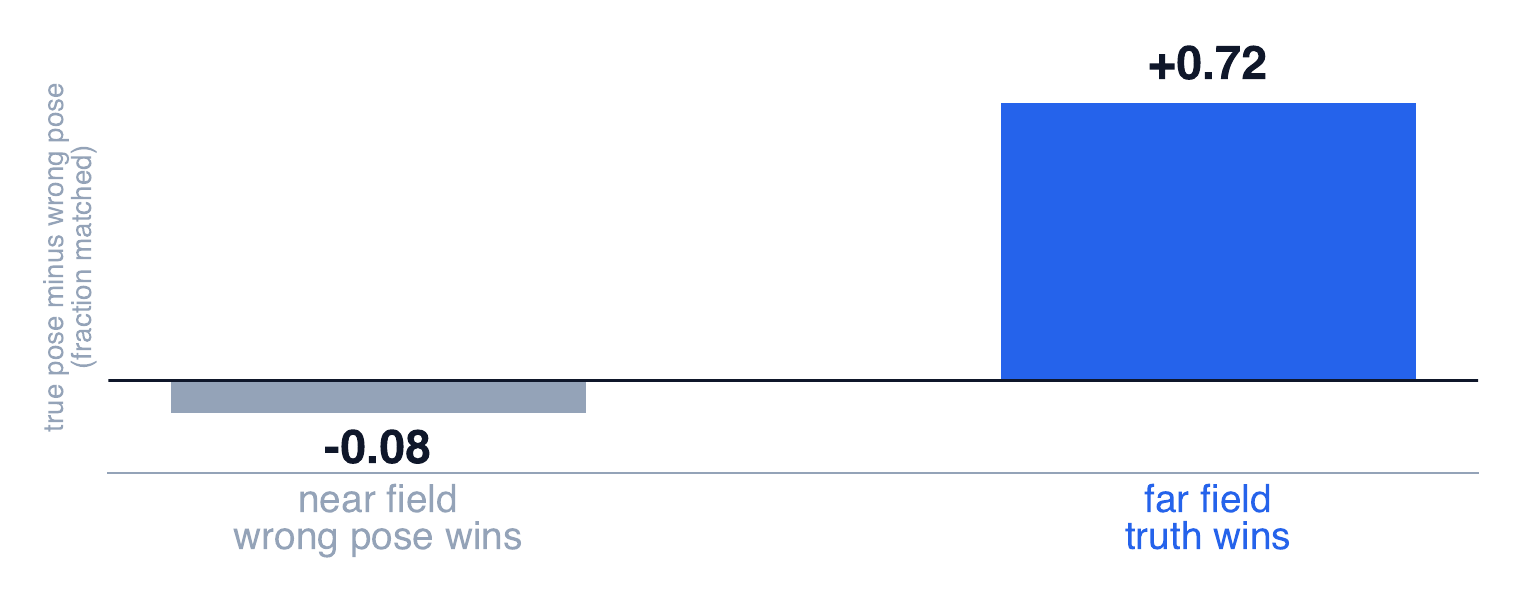
We made the final decision count only the far half of the search window, falling back to the whole scan when there are fewer than 32 far returns. Together with a different verification statistic and a few ICP iterations on every candidate before comparing them, that took the office map from SR@fine 0.17 to 0.70.
Where it ended up
| days left | version | 18 unseen maps (mean) | dev |
|---|---|---|---|
| 2 | dev-tuned version | 45.24 (on the corrected benchmark) | 99.91 |
| 1 | map-derived constants + candidate harvest | 56.56 | 99.89 |
| final day | + new verification statistic, refine every candidate | 61.02 | 99.89 |
| final day | + far-field check | 64.42 | 99.89 |
The dev submission stayed byte-identical from the day before the deadline on, which is our check that the derived constants come from the map alone.
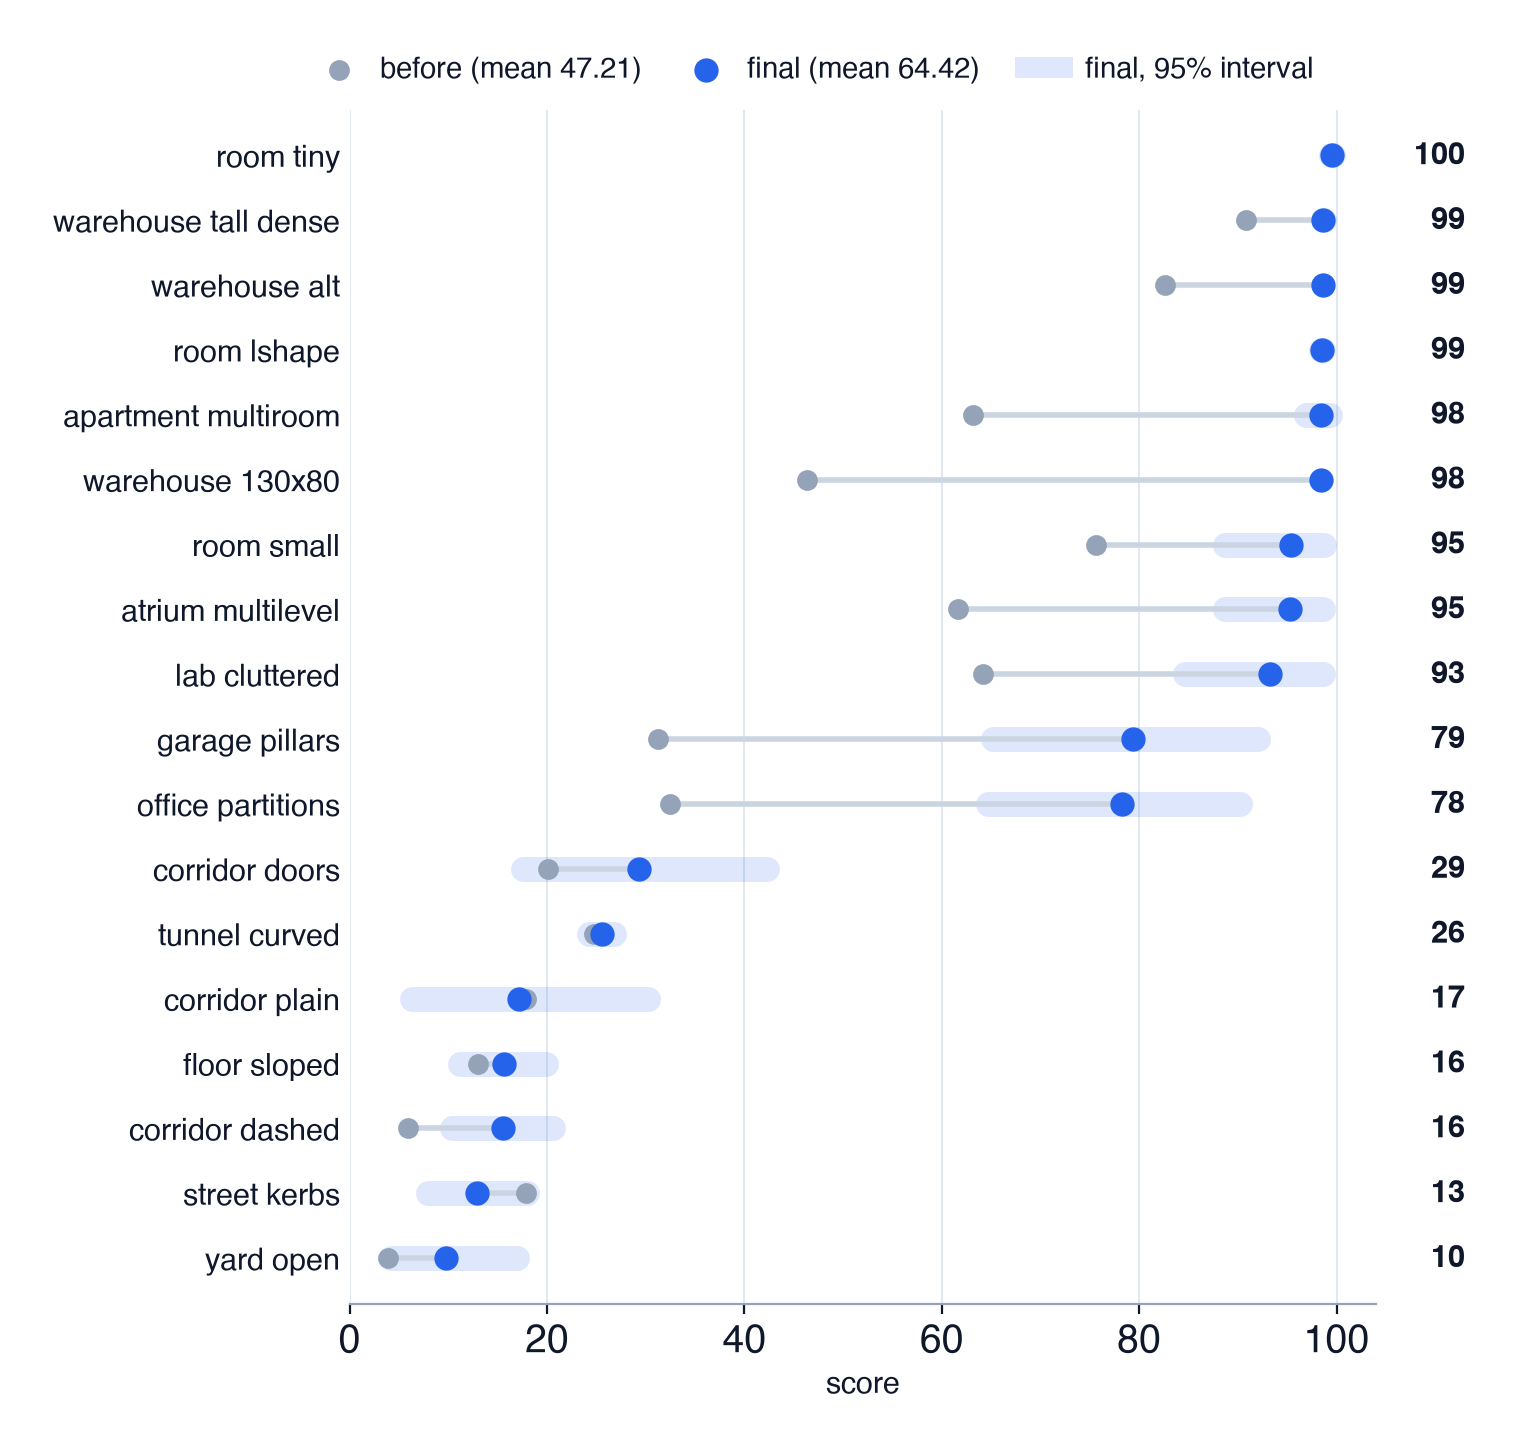
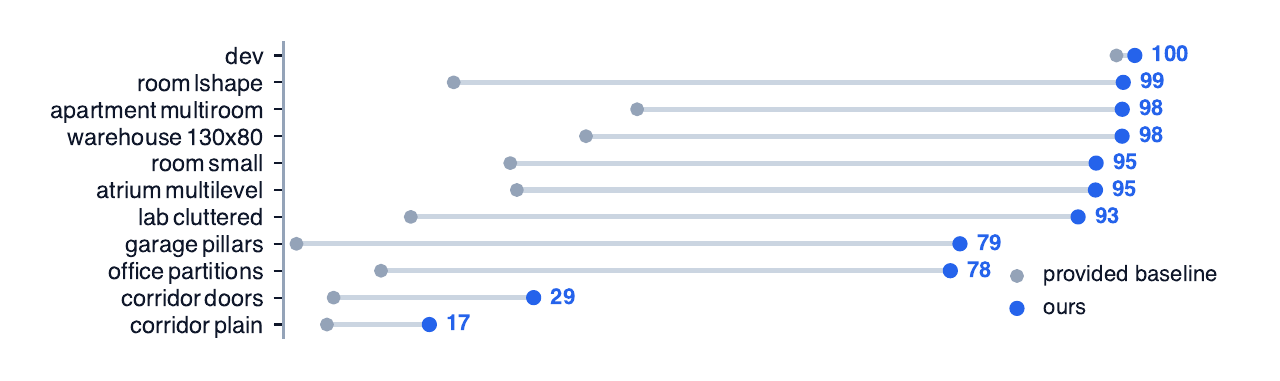
A note on sample size: each synthetic map has 30 poses (23 and 29 on the two smallest rooms, where there isn’t space for more). The intervals in the chart are wide, especially in the middle of the range, so read the shape of the table rather than the second decimal. The 130 × 80 m warehouse also came from a generator we didn’t write, so its scans still share the map’s sampling and its 98.40 should be read as an upper bound. Only the dev row is a real score; the synthetic maps are for rejecting ideas.
For comparison, we ran the provided baseline, unmodified, on the same benchmark. It still gets 97.74 on dev, averages 21.08 on the unseen maps, and falls below random on the dashed corridor.
What it cost, and what still fails
Dev went down, from 99.952 to 99.895. About 0.011 of that is the price of replacing hand-tuned constants with measured ones. The other 0.047 is the offset correction. On an unknown map the 2.4 mm offset doesn’t correct anything; it just shifts every pose by 2.4 mm, so we dropped it. We’d rather ship the lower dev number we can defend.
Five maps remain unsolved: the open yard, the dashed corridor, the street, the curved tunnel and the sloped floor, scoring between 9.7 and 25.5, with SR@fine 0.000 on four of them and 0.033 on the yard. For two of them the scans themselves are thin. Counting returns more than 0.15 m above the floor, the median yard scan has 1,486 and the dashed corridor has 41, against 30,878 in a warehouse.
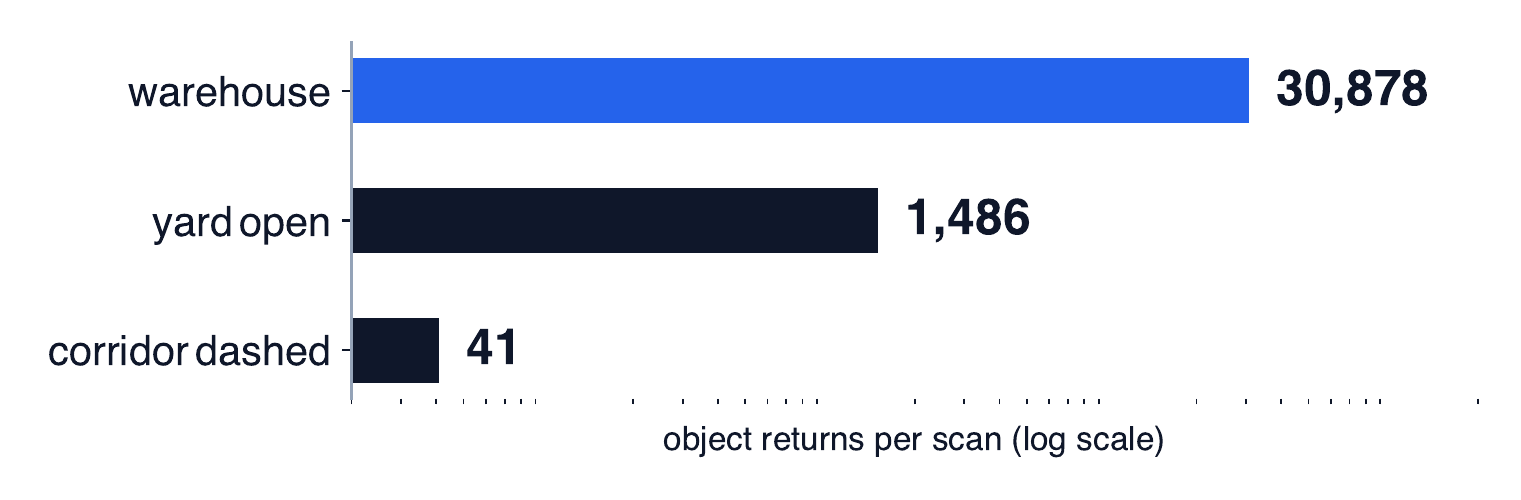
That doesn’t prove those maps are impossible, and we only tested our own family of methods. It does mean that the correlator, the ICP refiner and the camera are all working from the same 41 points.
So yeah
We spent two weeks getting really good at one warehouse, and then found out the test might not be a warehouse at all. Two days later the thing reads its constants off whatever map you hand it, went from 47 to 64 on maps it had never seen, and still gets lost in an empty yard.
If there’s a lesson, it’s to write down what you’re betting on, and to try breaking your benchmark before you believe it.